
In December, Data Prep and Insights are making the headlines!
Data science
-
Insights
-
AI-powered predictions (Google Analytics only)
Data sources
-
Data Prep
-
New connector: Quintessence
-
Live mode for Google BigQuery, mySQL, PostreSQL, Google Sheets, and CSV
-
Enhanced data sources: Google BigQuery, mySQL, PostreSQL, CSV, and Magento
Data visualization
-
New data visualization: Custom chart
-
Gaugechart: the gauge ratio is now customizable
-
New Shape Widgets
-
Ruler guidelines in the Builder mode
Extended account administration features
-
Quota monitoring
Security & infrastructure
-
Connectivity monitoring (Builder mode only)
Data science
Insights
From the Viewer mode, toggle the "Insights" tab located in the bottom right corner and click on any Widget to uncover insights! You'll get to find out things like what Dimensions really impact your Metrics or whether there's a correlation between your Metrics.

AI-powered predictions (Google Analytics only)
Working on your next business plan? In just a few clicks, forecast the KPIs that matter most to your business with our cutting-edge AI algorithms. Hassle free. No coding skills required. This feature is invite-only, contact us for more information.

Data sources
Data Prep
Data Prep is the place where you can manage any data source. There, you'll be able to add Metrics and Dimensions to your favorites so they are easier to access as you build your dashboards, select which Metrics and Dimensions you want to show or hide in order to avoid nuisance and create Calculated Metrics once and for all (e.g. for Google Analytics, creating your own metric called "Qualified visits" with the following expression: - ).

New connector: Quintessence

Live mode for Google BigQuery, mySQL, PostreSQL, Google Sheets, and CSV
In addition to the ability to clear the cache on CSV-based connectors, you can now activate the Live mode, allowing you to build real-time dashboards as your data source gets updated!

Enhanced data sources
Google BigQuery, mySQL, PostreSQL, CSV, and Magento connectors just got a makeover for you to have an even better experience as you connect and explore them!
Data visualization
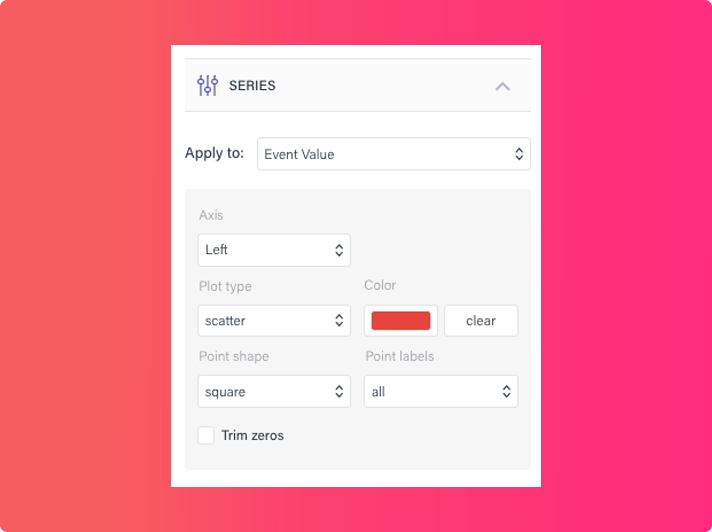
New data visualization: Custom chart
Thanks to this new type of data visualization, you can now assign any settings (plot type, color, axis, etc.) to each and every metrics of your widget..

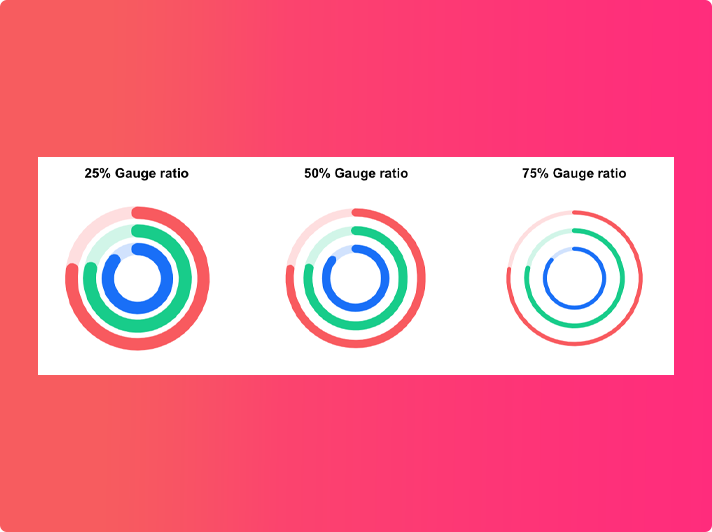
The Gauge chart's ratio is now customizable
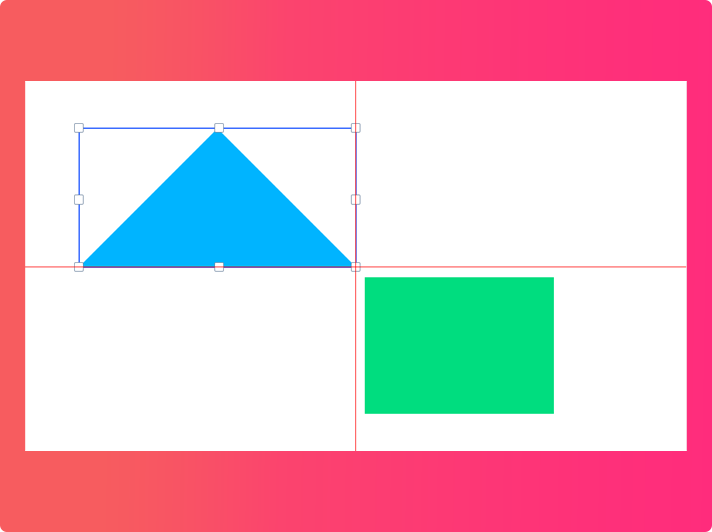
New Shape Widgets

Ruler guidelines in the Builder mode
Get a PowerPoint-like experience as you move your widgets around.
Extended account administration features
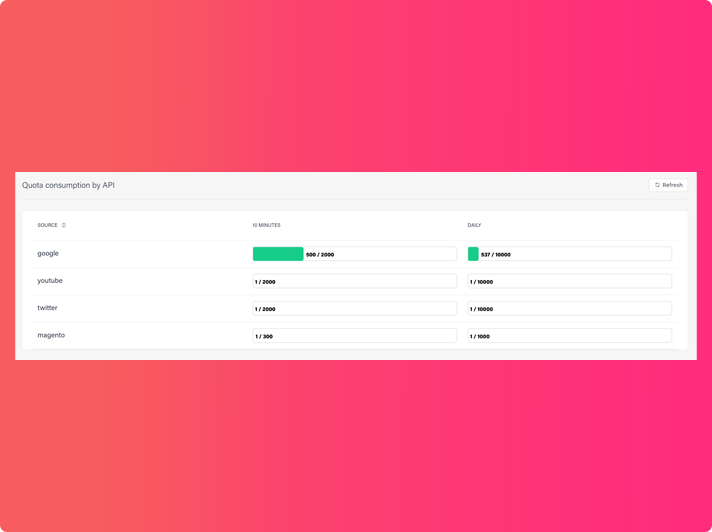
Quota monitoring
From the Organization administration settings, you can now check your 10-minute and daily quota consumption per API.
Security & infrastructure


COMMENTAIRES